Catania Astrophysical Observatory Laboratory for Detectors
")
")
Front-end used in the set-up
The Photon Detection Efficiency (PDE) measurements with pulsed source, are carried out using the same front-end electronics adopted by the ASTRI Mini Array project, based on the ASIC CITIROC 1A manufactured by WEEROC. Here only the circuits involved in the PDE evaluation and in general in the SiPM detectors characterization are described.
The analog core of the chip has 32 channels that incorporate:
Figure 1 shows the block diagram of one channel.
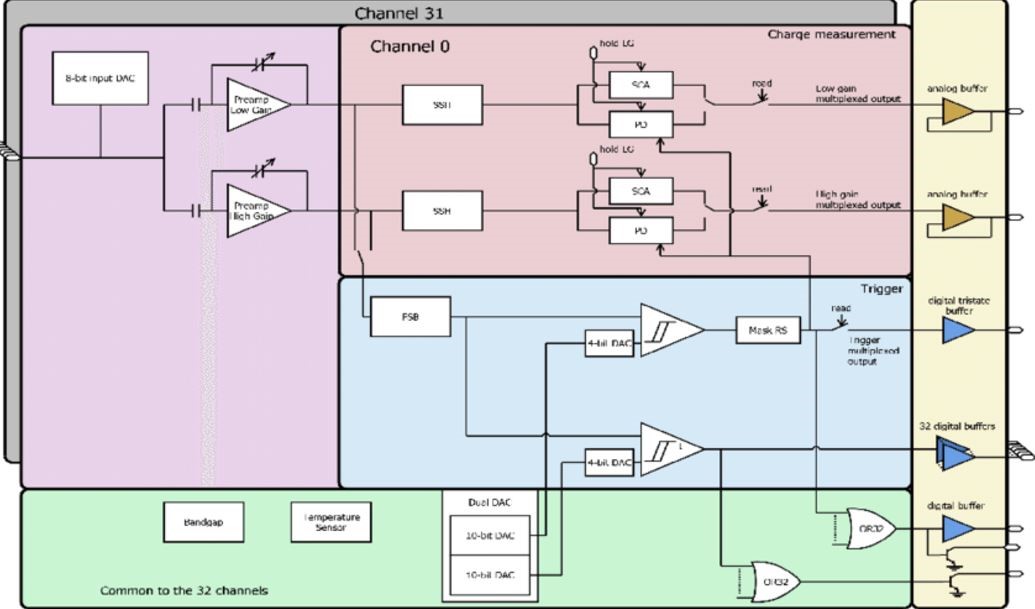
Figure 1. A single channel block diagram of the CITIROC.
Pulse Height Distribution measurement for the PDE evaluation
The CITIROC part used to obtain Pulse Height Distribution (PHD) measurements is shown in Figure 2.
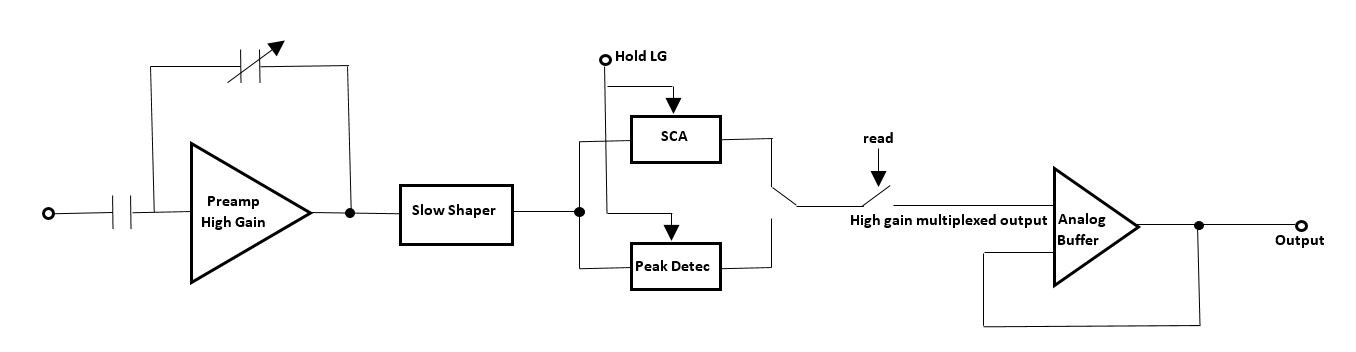
Figure 2. Schematic of the electronics used to measure the Pulse Height Distribution.
In this case the SiPM pulse is amplified by the High Gain (HG) preamplifier and is shaped by theSlow Shaper that provides a charge measurement. The peaking time can be tuned thanks to the slow control parameters. Seven CRRC shaping times (from 12.5 ns to 87.5 ns) are available for thisSlow Shaper. The selected “peaking time” for our experiments is 37.5 ns. The amplitude of the pre-amplified and shaped signal at its peaking time is saved by using a track and hold cell. The hold control signal is directly provided to the ASIC by the user on a dedicated pin (Holdb). The selected “Holdb” time for our experiments is 120.0 ns. Analogue data is stored at the same time on the Switched Capacitor Array (SCA). The read register through the signal “Read” controls the readout of this analogue memory. The selected “Read” time for our experiments is 10 μs.
Figure 3 shows the schematic of the Track and Hold module while Figure 4 shows the standard working mode.
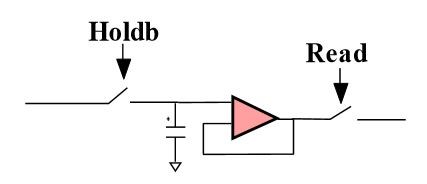
Figure 3. Schematic of track and hold cell.
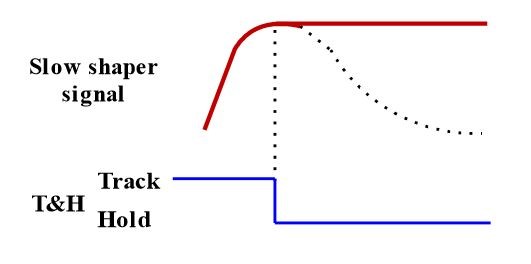
Figure 4. Standard Track and Hold working mode.
The signals used to acquire the pulse height distribution are the HOLD to control the Track and Hold cell and the TRIGGER to control the pulsed light source generator. The Pulse generator LeCroy ArbStudio 1104 generates both signals to drive the entire acquisition process. The HOLD signal has to be delayed with respect to the TRIGGER signal of additional 40ns as the LASER controller and the LED driver need 40ns to generate the flashlight. This gives a total HOLD time of 160ns respect to the TRIGGER signal. Figure 5 shows the two signals: in the panel a) the 160 ns delay is evident, while panel b) shows the duration of 10 ms of the “Read” signal, finally panel c) shows the 10 KHz or 10000 pulses/s.
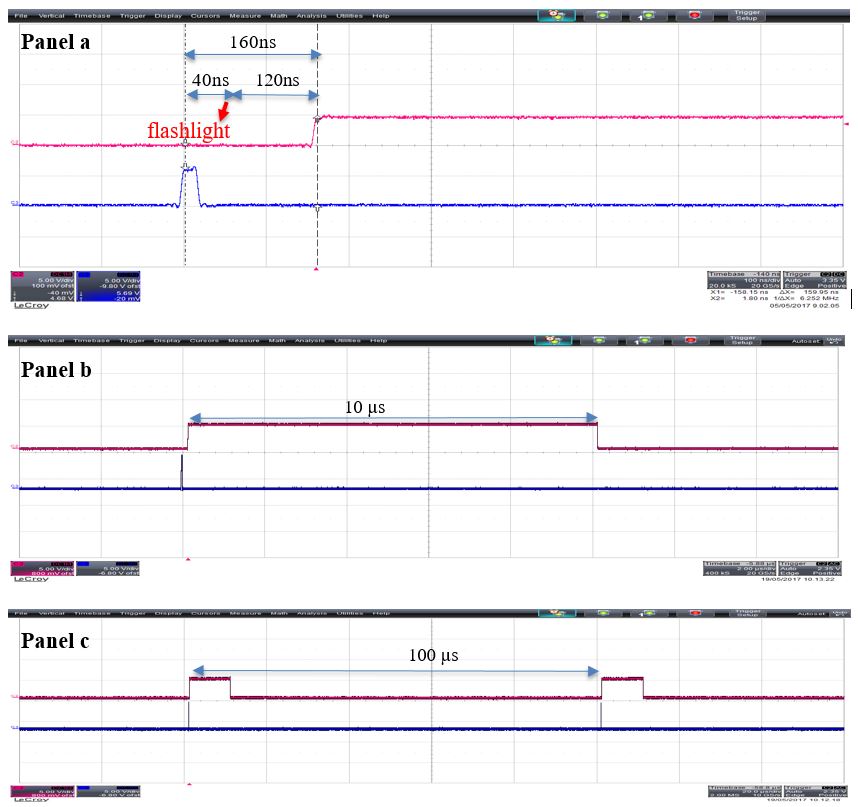
Figure 5. anel a) HOLD (red waveform) and TRIGGER (blue waveform). To be noted the total 160ns delay respect to the TRIGGER signal. Additional 40ns are required by the pulsed light sources to be ready for firing. Panel b. The duration of the HOLD signal before to go down is 10μs, in fact we select this for the “Read” signal.Panel c) The repetition time is 100μsmeaning 10 KHz or 10000 pulses/s.
The amplitude of TRIGGER signal is settled to 3.0V for the pulsed Laser sources while is adjusted in the range 800mV - 6.0V (depending of the source) for the pulsed LED light sources.
The PDE measurement is based on the statistical analysis of the pulse heights distribution of the SiPM devices both in light and in the dark conditions.
The used technique was widely discussed in P. Eckert et al., NIMA 620 (2010) 217-226 "Characterization studies of silicon photomultipliers" and in the Hamamatsu document "Technical information MPPC Modules".
The statistical analysis assumes that the number of photons emitted by each impulse (laser and LED) follows the Poisson distribution:
 |
(1) |
Where:
x: Number of detected photons
x ̅: Mean number of detected photons
In case of absence of photons that means for x = 0 the (1) changes in:
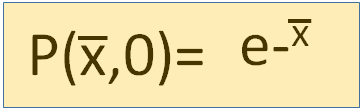 |
(2) |
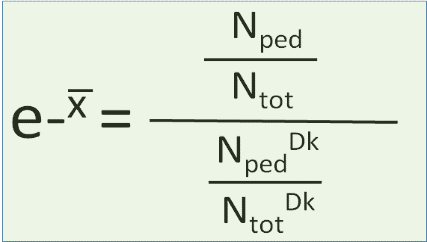
On the other hand, if we indicate with Nped the number of events at 0 p.e. and Ntot the total number of events, the distribution P (x ̅, 0) is given by the ratio Nped/Ntot, that has to be corrected for the presence of the dark expressed by the ratio Nped dark/NtotDK:
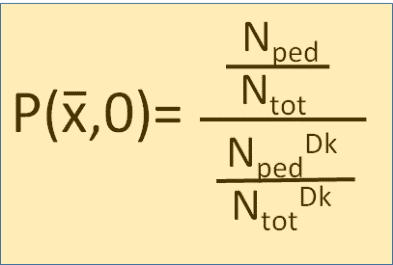 |
(3) |
Where:
Nped is the number of events at 0pe ( that is the pedestal) with light source.
Ntot is the number of the total events with light source.
NpedDK is the number of events at 0 p.e. (that is the pedestal) without light source (Dark).
NtotDK is the number of the total events without light source.
By equating member-to-member (2) and (3) we obtain:
 |
(4) |
That, applying the logarithm to the two members, turns in:
 |
(5) |
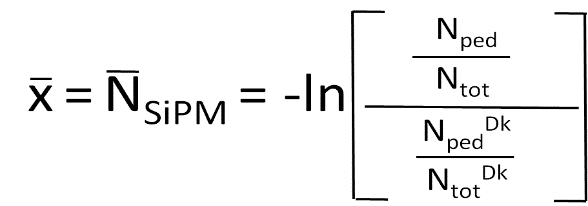
From which we derive the average number of photons NSiPM detected by SiPM:
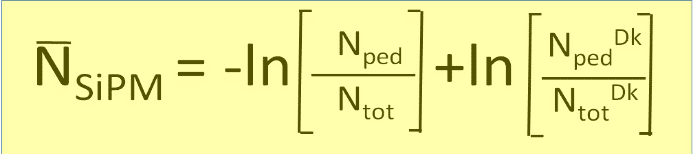 |
(6) |
If the total number of pulses with light source Ntot equals the one without light source (Dark condition) Ntot = NtotDK
We have:
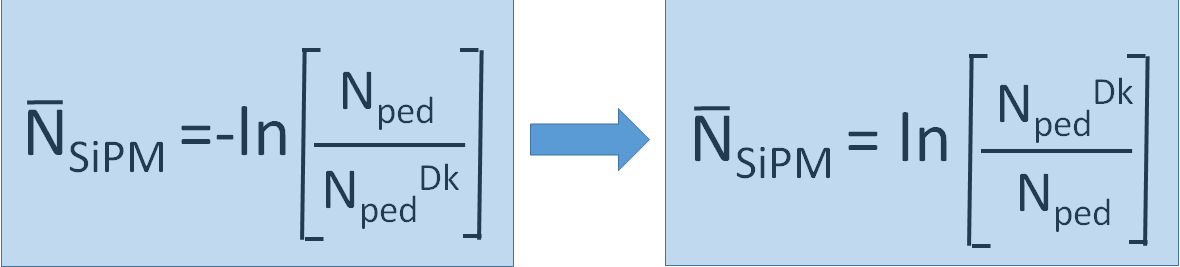 |
(7) |
Considering the average number of photons detected by the calibrated photodiode Nph cal-Diode and the sensitive areas of both detectors, we can obtain the PDE as:
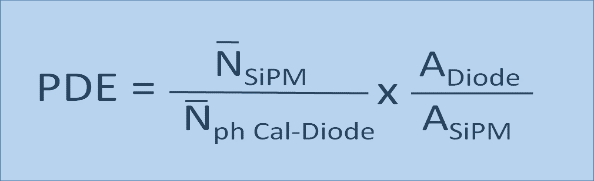 |
(8) |
Where:
 |
(9) |
With Ne the number of photoelectrons detected by the calibrated photodiode and QE(λ) its Quantum Efficiency QE (λ).
Figure 6 shows a theoretical PHD with and without pulsed light.
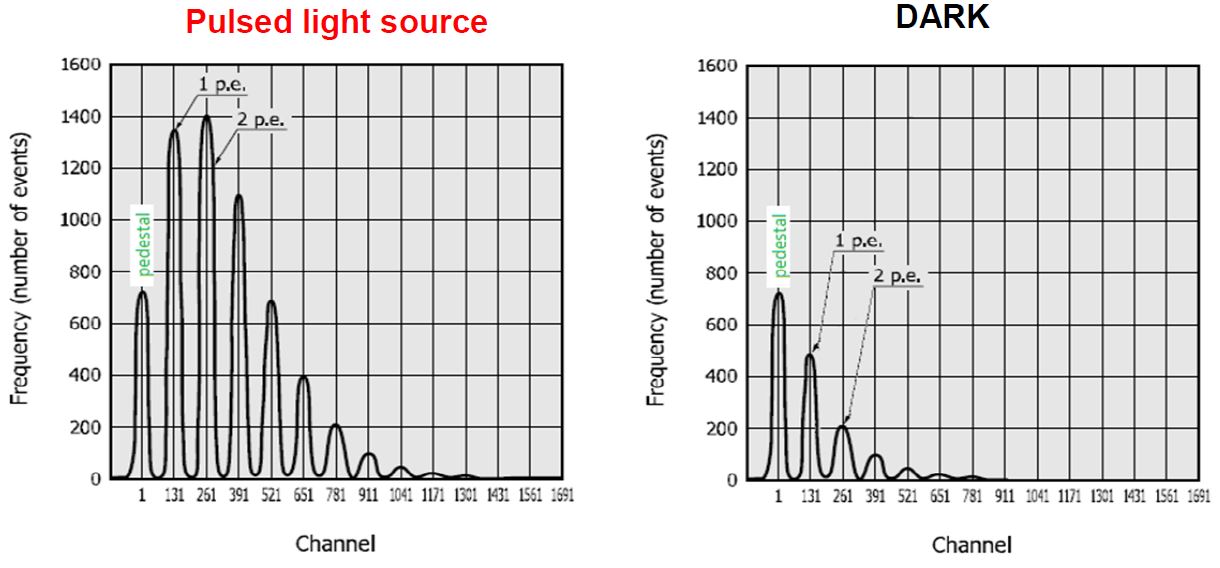
Figure 6. Theoretical Pulse Height Distribution with (left plot) and without (right plot) pulsed light.
The combined plots depicted in Figure 7 show how the dark can influence the PDE measurement..
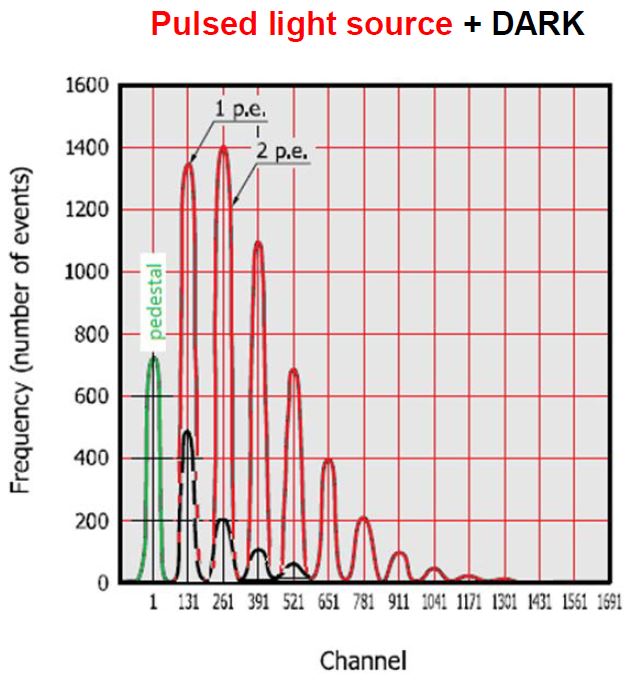
Figure 7. Combined PHD related to the light source and to the dark. To be noted the same position of the pedestal in both cases.
The experimental case is reported in Figure 8 where the PHD plots for the MPPC LCT5 3x3 mm2, pich size 75μm in both operating conditions are shown. As pulsed light source we used a Laser source with wavelengthλ=405nm.
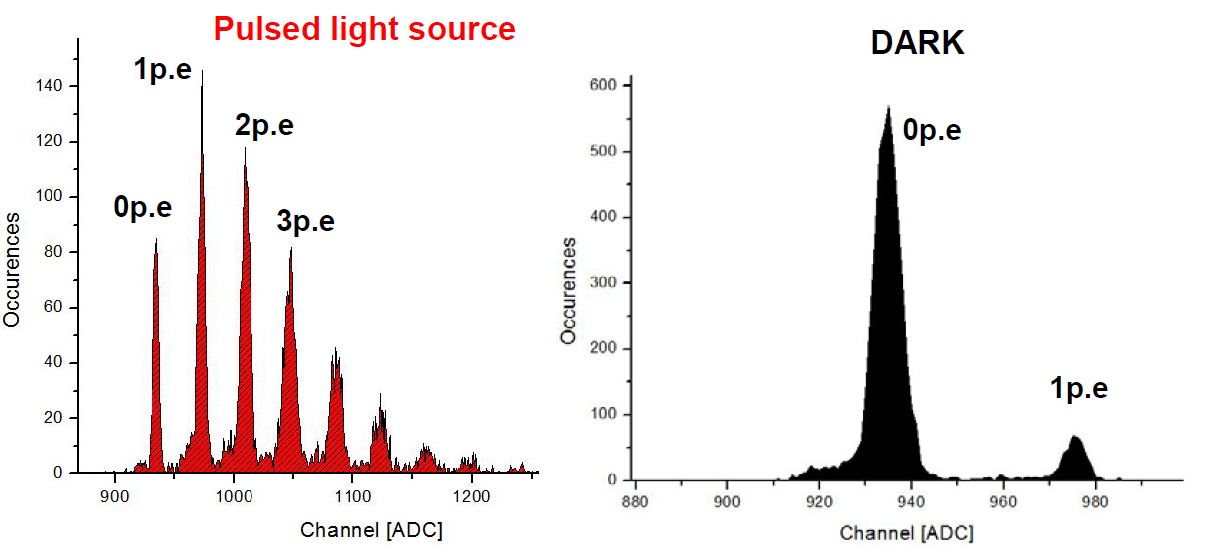
Figura 8. PHD plots for the MPPC LCT5 LCT5 3x3 mm2 (micro-cell 75µm) i illuminated (left plot) and in dark (right). To be noted the same position 934 ADC of the pedestal in both cases.
As can be noted for each peak of the distribution we have the correspondent ADC value of the level of one photoelectron (1p.e.), two photoelectrons (2p.e.), and so on. The distribution of the occurrences will follow the Poisson law of course. At the base of each peak can be observed anenlargement due to the optical cross talk and after-pulse effects. Only the first peak (pedestal = 0p.e.) is not affected. The distribution corresponding to the 0p.e., named Nped, indicates the number of events due to the signal (either source or dark) not affected by OCT and after pulse because no extra photons are generated by the primary photon.
Nped e NpedDK sare used to evaluate the average number of photons detected by the SiPM, named NSiPM, in the formula (8) and thus to evaluate the PDE.