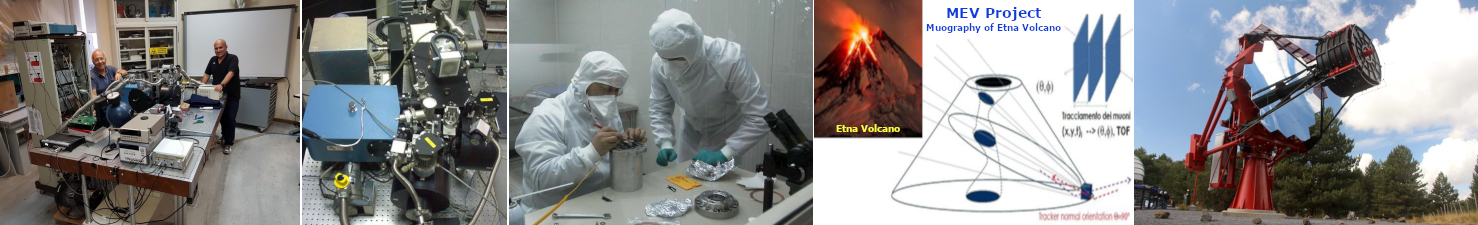
Catania Astrophysical Observatory Laboratory for Detectors
")
")
Characterization Set-up
We schematized the adopted setup in Figure 1. The apparatus allows PDE measurements in the spectral range of 240 - 1000 nm by using 18 pulsed light sources. The wavelength of each source is reported in Table 1. Furthermore, we use the same setup to measure Dark Count Rate (DCR) and Optical Cross Talk (OCT) versus Overvoltage.
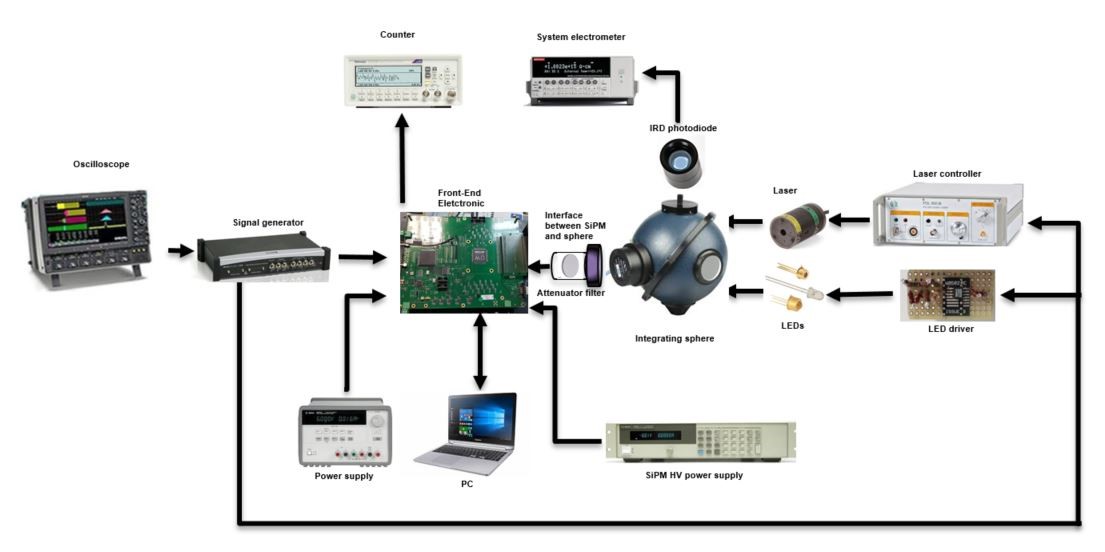
Figure 1. Characterization setup based on the use of pulsed light sources: Lasers and LEDs
The system is constituted by:
Available pulsed light sources
The pulsed light sources available are in total 19 of which 16 LED sources and 3 Laser sources.
|
Identification code |
Wavelength [nm] |
Spectral distribution |
Type |
|
LDH-P-C-405 |
405 |
Laser |
|
|
EPL-450 |
450 |
|
Laser |
|
LDH-P-635 |
635 |
Laser |
|
|
LED285W |
285 |
LED |
|
|
LED315W |
315 |
LED |
|
|
LED341W |
341 |
LED |
|
|
LED385L |
385 |
LED |
|
|
LED430L |
430 |
LED |
|
|
LED450L |
450 |
LED |
|
|
LED465E |
465 |
LED |
|
|
PLS-8-2-746 |
496 |
LED |
|
|
LED505L |
505 |
LED |
|
|
LED525L |
525 |
LED |
|
|
LED570L |
570 |
LED |
|
|
LED591E |
591 |
LED |
|
|
LED660L |
660 |
LED |
|
|
LED680L |
680 |
LED |
|
|
LED780E |
780 |
LED |
|
|
LED851L |
851 |
LED |
Table 1 – Lists of pulsed light sources: LED and LASER and their respective wavelength
Led driver
To drive the LED sources, we designed and built an appropriate electronic circuit for fast signals. The schematic is depicted in Figure 2.
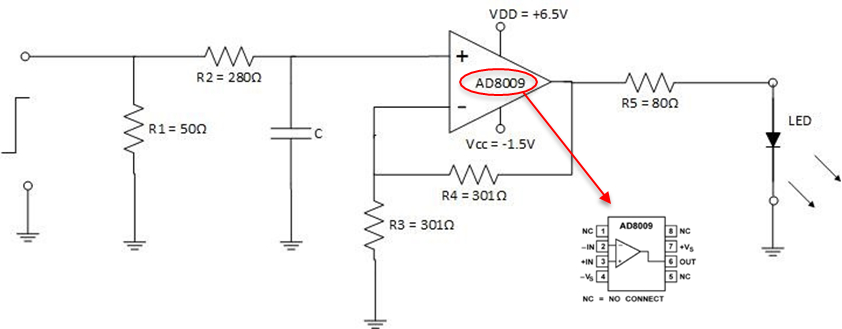
Figure 2. LED driver schematics
The circuit is based on the AD8009 ultra-fast amplifier in non-inverting configuration, capable of conditioning signals at a slew rate of 5.5V/μs (545ps rise time). These features make it ideal as a pulse amplifier.
The AD8009 is characterized by a 440MHz bandwidth at gain G = 2, and is also capable of delivering more than 175mA of load current, while maintaining a low differential gain and a reduced phase error. It is powered with a dual voltage of VDD = + 6.5V and VCC = -1.5V.
In the specific case, the gain was set to 2 by means of the two feedback resistors. At the input, a coupling resistance (R1) interfaces the signal coming by the function generator whose amplitude is suitably modulated to vary the LED intensity.
The signal is represented by the waveform (blue color) shown in Figure 3.
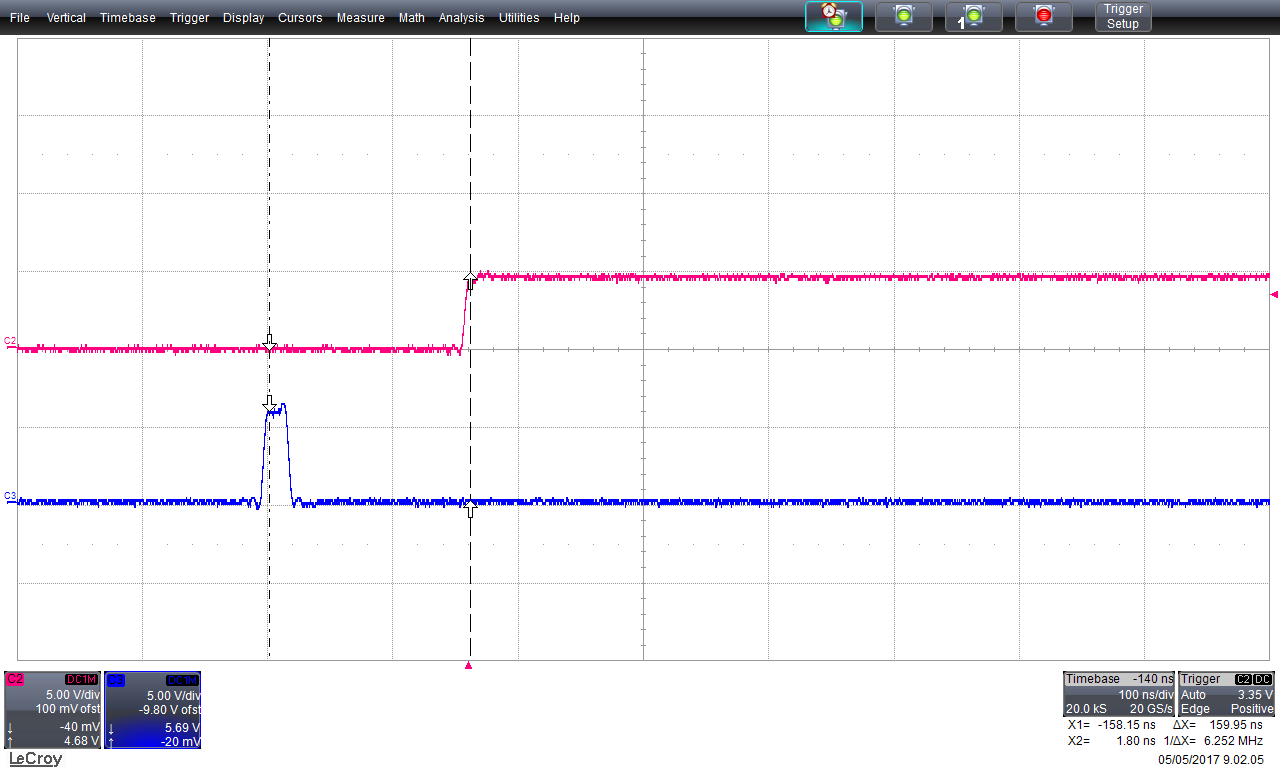
Figure 3. Input signal for the LED driver (waveform blue color) and synchro signal (waveform red color) named HOLD.
In Figure 3, in addition to the signal transmitted to the LED driver (blue waveform), the sync signal (HOLD) is present.
Specifically, each LED has an appropriate polarization voltage, which is settled at levels to have a suitable photon flux inside the integrating sphere. We recall that for the correct PDE measurements the system must work in single photon counting regime.
Neutral density filters: type and calibration
To avoid working with luminous level that could saturate the SiPM (degrading the PDE) and at the same time have sufficient current signal detected by the photodiode, we consider mandatory the reduction of the photon flux on SiPM by introducing optical attenuators. These last are neutral filters of different optical transmittance. For this purpose, we calibrated with high accuracy each single filter to determine the transmittance value according to the correspondent wavelength.
The set-up used for calibrating the filters is shown in the diagram of Figure 4.
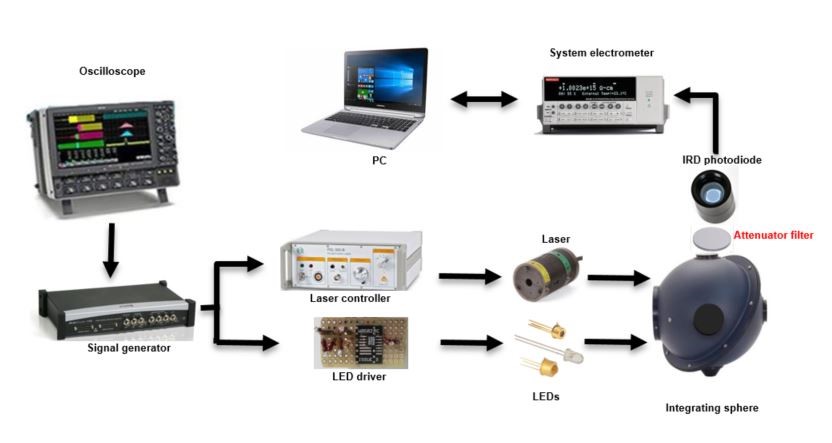
Figure 4. Set-up for calibrating the neutral density filters.
We repeated each single measurement in different light intensity conditions changing both the voltage level and the frequency of the source and alternated the acquisition cycle on a run of 100 measurements of the photocurrent four times with and without the introduction of the attenuator filter to be calibrated. The standard deviation for each set of measurements resulted less than 1%. The final transmittance value is given by the arithmetic mean of the four measurements.
The calibrated neutral density filters are:
ND30B, ND20B, ND13B e ND10B from Thorlabs.
Table 2 shows the result of measurements in terms of transmittance.
In addition, the third column shows Quantum Efficiency of the IRD photodiode whose values are NIST traceable.
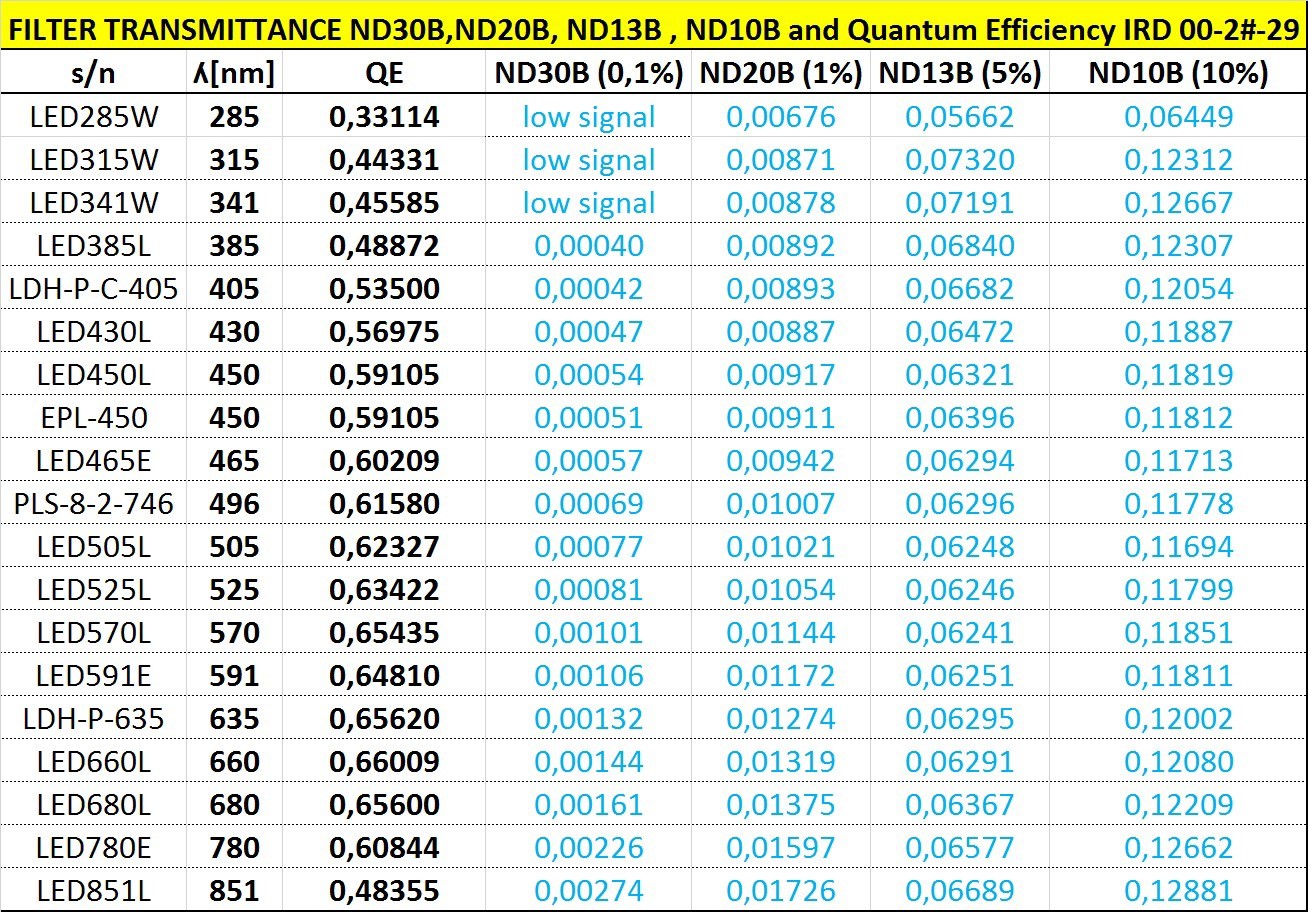
Table 2 – Neutral density Filters transmittance and IRD photodiode Quantum Efficiency
For the ND30B filter, it is impossible to evaluate the transmittance for the first three wavelengths (285nm, 315nm, 341nm) due to the low detected signal compared to the signal without filter.