Photon Detection Efficiency measurements with continuous flux source
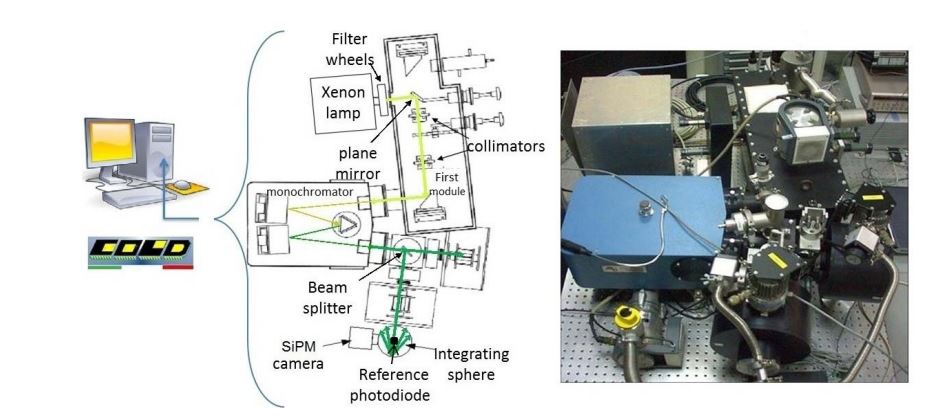
The experimental set-up adopted is partially based on optical systems, such as light sources, precision filters, monochromator and integrating sphere, and partially based on particle counting equipment. The main instruments involved in the set-up are:
• The COLD-INAF optical apparatus;
• A Keithley 6514 femtoammeter;
• Unit PSAU CAEN SP5600;
• A Tektronix FCA3000 frequency counter;
The photon flux intensity coming into the integrating sphere can be regulated by means of neutral density filters or changing the aperture of the entrance or exit slits of the monochromator.
Due to the small dimensions of the detectors to be characterized with respect to the optical beam, the integrating sphere is used to spatially integrate the radiant flux. Furthermore, appropriate mechanical structures are realized, in terms of both aperture and distance from the centre of the sphere, to illuminate the SiPM detector and the NIST-traced photodiode with the same radiant flux. The reference photodiode allows to evaluate the number of photons per unit area, and then, after a proper rescaling, the number of photons impinging on the detectors under test.

of the implemented mechanical and optical parts of the apparatus, where the green line indicates the light path.i
Only a fraction of the total number of photons impinging on the SiPM detector actually triggers avalanches and, as a result, a detectable signal. The foremost reasons for such inefficiencies are geometrical (inactive regions between microcells), physical (reflection/absorption by passive layers), and electrical (photon conversion occurring where the electric field is not suitable for triggering the avalanche). The overall efficiency of the sensor is usually referred to as PDE, defined as the statistical probability for an incident photon to generate a Geiger pulse from one of the SiPM microcells, and it therefore relates the real number of impinging photons to the measured ones.
More specifically, the SiPM PDE is a function of wavelenght and overvoltage, and is basically determined by
![]()
where η (λ) is the wavelenght dependent quantum efficiency of silicon, (VOV) is the avalanche initiation probability of charge carriers, and F is the device geometrical fill factor.
The silicon quantum efficiency η (λ) is the probability for an incident photon to generate an electron-hole pair in a region in which carriers can produce an avalanche discharge. The SiPM layer structure is optimized to have the highest probability for a visible photon to be absorbed in the deplection layer. The band gap of silicon puts a superior limit to the operating wavelenghts, while surface reflections and junction depths limit the detection of photons towards the lowest wavelenghts. The avalanche breakdown probability (VOV) represents the probability that a seed carrier in the deplection region initiates a Geiger discharge, and is a function of the applied bias voltage, since it depends on the impact ionization coefficients of charge carriers, which are strong functions of
the electric field. The geometrical efficiency factor F is defined as the ratio of the total active area of the SiPM microcells to the overall device area, as a result of the gaps among the pixel photodiodes, and is solely determined by the detector topology. SiPM PDE is commonly calculated from the responsivity of the detector in terms of average photocurrent produced per unit optical power. This method, however, does not account for the noise contributions of cross-talk and afterpulsing, and therefore gives a slight over-estimation of the measured PDE.
SiPM absolute PDE measurements are here performed based on the photon counting method, by which the number of pulses per unit time in monochromatic light conditions are compared to the light level recorded by a reference NIST photodetector at the same time and for several wavelengths.
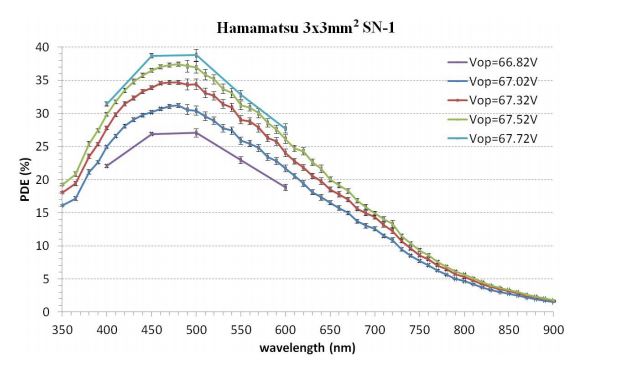
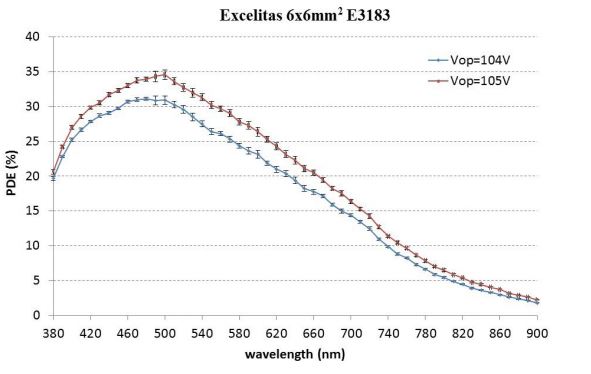
Figure 2 and Figure 3 illustrate the PDE measurements respectively for the Hamamatsu 3×3 mm2 and Excelitas 6×6 mm2 detectors over a large wavelengths spectrum and for different operating conditions.
 Figure 2. PDE measurements as a function of wavelength of the Hamamatsu SN-1 detector for different operating voltages.

Figura 3. PDE measurements as a function of wavelength of the Excelitas E3183 detector for different operating voltages.


